close

 3UTS | pdb_00003uts

1E6-A*0201-ALWGPDPAAA Complex, Monoclinic


Experimental Data Snapshot

  • Method: X-RAY DIFFRACTION
  • Resolution: 2.71 Å
  • R-Value Free: 
    0.269 (Depositor), 0.263 (DCC) 
  • R-Value Work: 
    0.201 (Depositor), 0.201 (DCC) 
  • R-Value Observed: 
    0.205 (Depositor) 

wwPDB Validation   3D Report Full Report

Image

This is version 1.2 of the entry. See complete history


Literature

Structural basis for the killing of human beta cells by CD8(+) T cells in type 1 diabetes.

Bulek, A.M.Cole, D.K.Skowera, A.Dolton, G.Gras, S.Madura, F.Fuller, A.Miles, J.J.Gostick, E.Price, D.A.Drijfhout, J.W.Knight, R.R.Huang, G.C.Lissin, N.Molloy, P.E.Wooldridge, L.Jakobsen, B.K.Rossjohn, J.Peakman, M.Rizkallah, P.J.Sewell, A.K.

(2012) Nat Immunol 13: 283-289

  • DOI: https://doi.org/10.1038/ni.2206
  • Primary Citation Related Structures: 
    3UTP, 3UTQ, 3UTS, 3UTT

  • PubMed Abstract: 

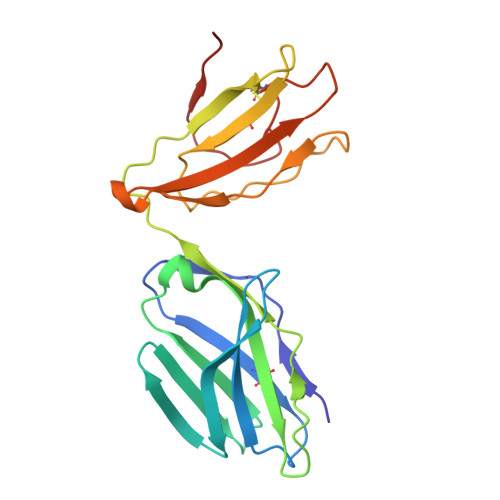
    The structural characteristics of the engagement of major histocompatibility complex (MHC) class II-restricted self antigens by autoreactive T cell antigen receptors (TCRs) is established, but how autoimmune TCRs interact with complexes of self peptide and MHC class I has been unclear. Here we examined how CD8(+) T cells kill human islet beta cells in type 1 diabetes via recognition of a human leukocyte antigen HLA-A*0201-restricted glucose-sensitive preproinsulin peptide by the autoreactive TCR 1E6. Rigid 'lock-and-key' binding underpinned the 1E6-HLA-A*0201-peptide interaction, whereby 1E6 docked similarly to most MHC class I-restricted TCRs. However, this interaction was extraordinarily weak because of limited contacts with MHC class I. TCR binding was highly peptide centric, dominated by two residues of the complementarity-determining region 3 (CDR3) loops that acted as an 'aromatic-cap' over the complex of peptide and MHC class I (pMHCI). Thus, highly focused peptide-centric interactions associated with suboptimal TCR-pMHCI binding affinities might lead to thymic escape and potential CD8(+) T cell-mediated autoreactivity.


  • Organizational Affiliation
    • Institute of Infection and Immunity, Cardiff University School of Medicine, Heath Park, Cardiff, UK.

Macromolecules
Find similar proteins by:  (by identity cutoff)  |  3D Structure
Entity ID: 1
MoleculeChains Sequence LengthOrganismDetailsImage
HLA class I histocompatibility antigen, A-2 alpha chain
A, F
276Homo sapiensMutation(s): 0 
Gene Names: HLA-AHLAA
Image
UniProt & NIH Common Fund Data Resources
Find proteins for P04439 (Homo sapiens)
Explore P04439 
Go to UniProtKB:  P04439
PHAROS:  P04439
GTEx:  ENSG00000206503 
Entity Groups  
Sequence Clusters30% Identity50% Identity70% Identity90% Identity95% Identity100% Identity
UniProt GroupP04439
Sequence Annotations
Expand
  • Reference Sequence
Find similar proteins by:  (by identity cutoff)  |  3D Structure
Entity ID: 2
MoleculeChains Sequence LengthOrganismDetailsImage
Beta-2-microglobulin
B, G
100Homo sapiensMutation(s): 0 
Gene Names: B2MCDABP0092HDCMA22P
Image
UniProt & NIH Common Fund Data Resources
Find proteins for P61769 (Homo sapiens)
Explore P61769 
Go to UniProtKB:  P61769
PHAROS:  P61769
GTEx:  ENSG00000166710 
Entity Groups  
Sequence Clusters30% Identity50% Identity70% Identity90% Identity95% Identity100% Identity
UniProt GroupP61769
Sequence Annotations
Expand
  • Reference Sequence

Find similar proteins by:  Sequence   |   3D Structure  

Entity ID: 3
MoleculeChains Sequence LengthOrganismDetailsImage
Insulin
C, H
10Homo sapiensMutation(s): 0 
Image
UniProt & NIH Common Fund Data Resources
Find proteins for P01308 (Homo sapiens)
Explore P01308 
Go to UniProtKB:  P01308
PHAROS:  P01308
GTEx:  ENSG00000254647 
Entity Groups  
Sequence Clusters30% Identity50% Identity70% Identity90% Identity95% Identity100% Identity
UniProt GroupP01308
Sequence Annotations
Expand
  • Reference Sequence
Find similar proteins by:  (by identity cutoff)  |  3D Structure
Entity ID: 4
MoleculeChains Sequence LengthOrganismDetailsImage
1E6 TCR Alpha Chain
D, I
201Homo sapiensMutation(s): 0 
Image
Entity Groups  
Sequence Clusters30% Identity50% Identity70% Identity90% Identity95% Identity100% Identity
Sequence Annotations
Expand
  • Reference Sequence
Find similar proteins by:  (by identity cutoff)  |  3D Structure
Entity ID: 5
MoleculeChains Sequence LengthOrganismDetailsImage
1E6 TCR Beta Chain
E, J
246Homo sapiensMutation(s): 0 
Image
Entity Groups  
Sequence Clusters30% Identity50% Identity70% Identity90% Identity95% Identity100% Identity
Sequence Annotations
Expand
  • Reference Sequence
Experimental Data & Validation

Experimental Data

  • Method: X-RAY DIFFRACTION
  • Resolution: 2.71 Å
  • R-Value Free:  0.269 (Depositor), 0.263 (DCC) 
  • R-Value Work:  0.201 (Depositor), 0.201 (DCC) 
  • R-Value Observed: 0.205 (Depositor) 
Space Group: P 1 21 1
Unit Cell:
Length ( Å )Angle ( ˚ )
a = 93.68α = 90
b = 84.59β = 90.03
c = 126.28γ = 90
Software Package:
Software NamePurpose
SCALAdata scaling
REFMACrefinement
PDB_EXTRACTdata extraction
GDAdata collection
xia2data reduction
PHASERphasing

Structure Validation

View Full Validation Report

Image

Entry History 

Deposition Data

Revision History  (Full details and data files)

  • Version 1.0: 2012-01-25
    Type: Initial release
  • Version 1.1: 2012-03-07
    Changes: Database references
  • Version 1.2: 2024-11-20
    Changes: Data collection, Database references, Derived calculations, Structure summary